Analyze and evaluate outputs
The analysis directory contains all the tools for analyzing and evaluating the outcomes from emulator and hardware target.
For more details on their parameters, call the scripts with
-h.
Allan variance
The Allan Variance for a ring-oscillator time series, whether obtained from measurement or emulation, can be computed. The Python script allanvariance.py plots the normalized Allan Variance versus the sample accumulation. As instance, the following command can be used to plot the Allan Variance of an emulated ring oscillator:
$ python allanvariance.py -t "Plot title" ro.txt allanvar.png
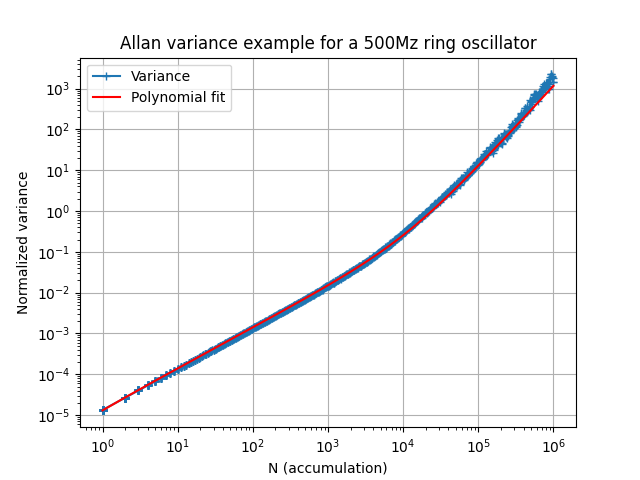
The Allan variance can also be plotted for the COSO output values in order to estimate respective thermal and flicker noise contributions.
COSO counter distribution
The counter values generated by the COSO, whether emulated or obtained from the FPGA board, can easily be visualized by creating a histogram using the following Python script:
$ python distribution.py --log -t "Plot title" coso.txt distribution.png
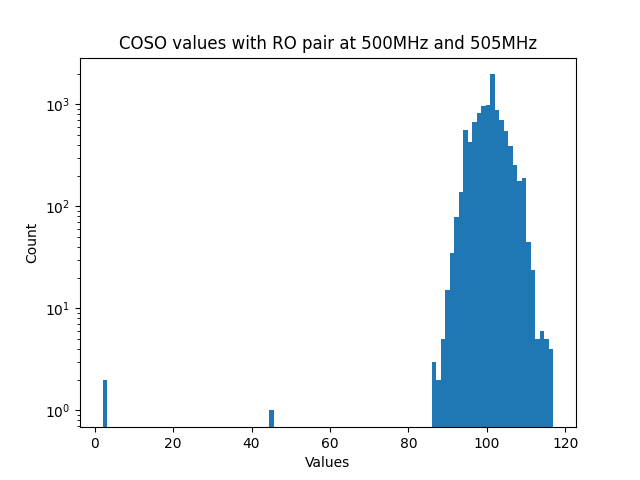
The provided example illustrates the generation of a COSO log-distribution plot using data from produced through emulator of two ring-oscillators at 500MHz and 505MHz.
Entropy estimation
Entropy estimators take binary files as input. The script tobinary.py can be used to convert ERO, MURO and COSO text output files to binary. This script takes one integer per line (value should be 0, 1 or n), then extracts the less significant bit (LSB) for each line and pack successive bits to bytes.
Generated binary streams entropy can be computed with the script entropy.py wich provides different estimators:
- Shannon entropy (Wikipedia)
- Most Common Value (from NIST SP800-90B)
- Markov (from NIST SP800-90B)
- T8 from BSI AIS 20/31 test procedure B
Estimators can be computed for different samples, from 1 bit width to 32 bits width.
$ python entropy.py -e mcv -b 8 ero.bin
The example above computes the Most Common Value (MCV) estimator on 8 bits samples read from the ero.bin binary file.
Auto-correlation
The Python script autocorrelation.py plots the autocorrelations for a random binary file, reading the file by words of b bits. The d parameter limits the maximum correlation lag (depth) of the signal with itself.
$ python autocorrelation.py -b 8 -d 100 -t "Plot title" coso.bin autocorr.png
This example plots the autocorrelation of the signal in a maximum lag of 100 samples of 8 bits each.